Automatically Estimating Sprint Tasks
In your development career, did you ever find yourself in a situation where you had to estimate the time to complete a sprint task? Maybe your manager wants to know how long it will take you to complete something. Or maybe you find yourself managing a team of developers and require an overview of your team’s performance. Predicting the time it takes to complete something is hard. More often than not, you will find yourself dealing with unpredictable events that affect your initial predictions.
Throughout the years, the Agile development methodology has become the de-facto standard for development. Its increase in popularity was mainly influenced by greater flexibility and incremental development approaches, which made it very appealing when compared to its alternatives, such as the Waterfall Model. Despite the advantages of Agile software development, it requires developers and managers to quickly adapt to changes in software requirements. Such changes sometimes lead to a higher sprint planning time.
Given that agile development requires frequent work estimation, reducing the time required to perform these estimations could prove highly advantageous for teams and companies. Therefore, having an unsupervised tool able to provide time estimates with a certain degree of confidence could bring huge benefits to the industry. It would not only allow developers to plan their work more efficiently, but also allow managers to plan better roadmaps. This article explores the possibility of building such a tool.
The Agile Mantra
For over a decade, the Agile methodology has played a vital role in shaping the landscape of software development. It has proven to be a very effective method for developing software, given its fast adaptation to requirement changes and incremental development approach. The increased contact with customers guarantees the end product is less likely to suffer large structural changes later in the development cycle, which reduces the overall cost of development.
However, despite its many benefits, the Agile process approach also requires development teams to quickly adapt to requirement changes. Changing an application early in its development cycle has little impact, as development teams can quickly adjust their design to meet expectations. Nevertheless, a change in requirements may occur later during development, leading engineers to invest additional time in planning to ensure both new and existing requirements are fulfilled. The time required for planning and estimating new stories will naturally depend on the complexity of the application.
Furthermore, the accuracy of such estimations will also depend on the experience of the development team. Experienced development teams tend to achieve more accurate estimations. But even an experienced team can sometimes over- or underestimate tasks, leading to Sprint spillovers. Having spillover tasks is not necessarily a negative indicator of a team’s performance, but could instead suggest that the initial story points did not reflect the amount of work necessary to complete a task.
Having a system able to gather and analyse Sprint data could provide large benefits to the software industry. Using historical data to create a relation between estimated story points and time to complete those story points may allow developers to plan sprints more accurately. However, before we focus on building a tool capable of gathering and predicting the time to complete sprint tasks, there are crucial factors that can influence the accuracy of estimations. We will briefly analyse these factors in the following section.
Estimation Accuracy
Estimating a task involves considering numerous variables. In the context of this discussion, one key factor previously highlighted is the experience of the development team. Experienced developers can identify potential development hurdles at an early stage. Moreover, a comprehensive understanding of the application being developed contributes to a more efficient development process. On the other hand, less experienced developers may struggle to efficiently plan and breakdown tasks, resulting in a longer development time.
Besides developer experience, there are also unpredicted events that can occur during development. These can be in the form of infrastructure downtime, preventing developers to deploy their changes for testing. Furthermore, unplanned events, such as outages, can largely affect the development time of ongoing tasks. These unplanned events can conflict with ongoing task prioritoes and may require the team to readjust the initial planning.
Furthermore, there are also personal factors that can affect the sprint’s outcome, such as developer availability. We will not delve into this topic, but it is something to keep in mind while designing the prediction model.
All these factors can end up skewing initial task estimates, making tasks last more than expected. These should be taken into account if the intent is to design an accurate prediction model. In this article, we mostly focus on the aspect of developer experience, as that seems to be the most impactful factor that could influence the prediction model. We may delve into the other factors in a future article.
After discussing the most influential factors for task predictions, we can start detailing how to provide Sprint estimates with a certain degree of confidence. The next sections go over the chosen strategy.
Estimating Sprint Tasks
Before detailing a possible approach for task estimations, it is important to highlight some assumptions that the model will make when gathering data from sprints:
- The data used for the prediction mode is assumed to come from a team using the Agile Development Strategy.
- The model assumes sprint duration does not change throughout development.
- The model assumes there are no changes to the development team.
With these assumptions, we can now discuss the model that will be used for task estimations. The model studied in this article was developed by Michael Larionov [1]. A key aspect mentioned in Larionov’s approach is the need to consider the seniority of the development team. This is a crucial factor, as it can largely affect the distribution of sprint estimates.
Larionov’s approach consists of using statistics to estimate sprint tasks. The main thesis of the approach is that estimates can be fitted to either a log-normal or a normal distribution. A key factor that influences the distribution of estimates is the experience of the development team and its knowledge of the ongoing project. Less experienced development teams tend to have a higher distribution of variance in their estimations, which produces a log-normal distribution of task estimates. More experienced teams tend to be more consistent, allowing their estimates to be fitted to a normal distribution
To better visualize this distribution, let’s use a similar Python script to the one used by Larionov [1].
import numpy as np
import matplotlib.pyplot as plt

# Plotting function
def plot_dist(frozen, min, max):
    _, ax = plt.subplots(1, 1)
    x = np.linspace(min, max, 100)
    ax.plot(x, frozen.pdf(x), 'r-', lw=5, alpha=0.6)
The script above defines a function plot_dist, which plots data in a graph bounded by the values minimum and maximum values min and max, respectively. Let us now introduce some data to test the model:
from scipy.stats import norm

# Simulated Sprint Estimations
sprint_point_data = np.array([27, 30, 32, 31, 28, 29, 34, 33, 26, 30])

# Plotting Normal
shape, loc = norm.fit(sprint_point_data)
fitted = norm(shape, loc)

# Calculating p95 value
print(f'95% confidence: {fitted.ppf(0.05)}\n')

plot_dist(fitted, 12, 50);
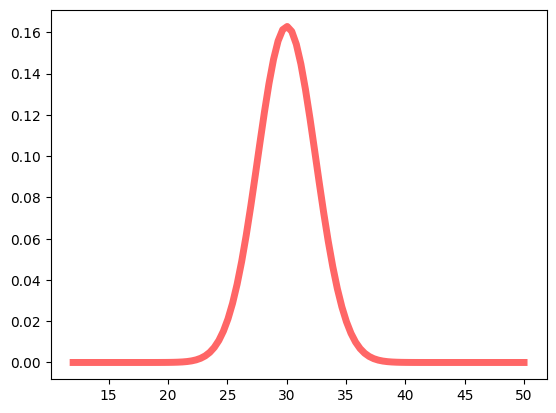
The array sprint_point_data from the previous script, contains Sprint estimations for a given team. In this specific example, our aim was to replicate the analysis for an experienced development team. Consequently, we opted for input data values with minimal variance, enabling us to represent them as a normal distribution in our plot. For this example, tge resulting P95 value is equal to ≈25.97. Therefore, we can guarantee with 95% confidence that we can complete 26 story points in one sprint. Below is a plot of the obtained results:
However, this would look quite different if we were to use data from a less experienced team. Let us now consider a different set of sprint estimates:
from scipy.stats import norm

# Simulated Sprint Estimations
sprint_point_data_2 = np.array([7, 8, 14, 12, 14, 13, 18, 16, 19, 17, 15, 12, 22, 21, 23])

# Plotting Log-norm
shape, loc, scale = lognorm.fit(sprint_point_data)
fitted = lognorm(shape, loc, scale)

# Calculating p95 value
print(f'95% confidence: {fitted.ppf(0.05)}\n')

plot_dist(fitted, 0, 40);
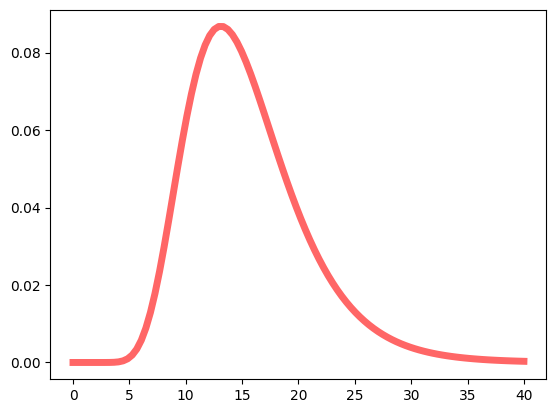
Notice that our data distribution is different from what we analysed in the previous example. Our first data points in the array sprint_point_data_2 indicate that the team was likely getting used to the project, as the estimations were quite low. In such scenarios, fitting the data to a normal distribution would not result in the most accurate output, as our data distribution appears to be right-skewed. Hence, a log-normal distribution is more appropriate in this context.
Analysing the distribution of story points is one of the key aspects to consider if the aim is to output accurate estimates. With this in mind, the model should provide an overview of sprint performance (with a certain degree of confidence). If you are a manager, this is most likely enough to plan roadmaps. However, it would be beneficial for developers to have a lower-level overview of these estimates for Sprint planning. So instead of viewing estimations on a Sprint level, we can attempt to apply a similar model on a task level. The next section will explore how we could provide developers with this estimate.
Creating a Relation between Time and Story Points
If the model is to be used by developers, it would be beneficial to predict how long a task would take to complete based on estimated story points. Story points are an abstract measure of complexity. Estimations are based on previously completed user-stories or tasks. This implies there should be a relation between all the user-stories completed with a certain amount of story points. This section presents a possible extension to Larionov’s model to study a correlation between tasks with the same estimated of story points.
Given this new model requires gathering data about task completion, we require a data structure capable of holding this information. A possible approach is to model this in Python using a matrix, where each row represents a single task. The first column stores story points and the second column stores the completion time for the task. In this article, completion time is tracked in hours, but this could be adjusted to minutes, if necessary. Let’s introduce an example that showcases the new approach.
from numpy import cumsum
from scipy.stats import lognorm

# A matrix containing the task data in the form 'story_points hours_taken'
task_data = np.matrix('1 2; 3 8; 5 12; 5 12; 3 6; 2 4; 1 3; 2 6; 8 17; 5 10; 5 16; 5 12; 5 12; 5 14; 5 11; 8 14; 8 9; 8 10')

# Retrieve estimations
task_estimations = np.array(task_data[:,0])
estimations_with_indices = np.unique(task_estimations, return_counts=True)
estimations = estimations_with_indices[0]
counts_by_estimation = estimations_with_indices[1]

# Compute the split sizes
split_sizes = cumsum(counts_by_estimation)

# Split array by story point estimation
sortedv1 = np.sort(task_data, axis=0)
list_sorted = task_data[np.apply_along_axis(lambda row: row[:, 0], 1, task_data).argsort()][0]
split_array = np.split(list_sorted, split_sizes[:len(split_sizes)-1], axis=0)

# Get position that matches story points
#    We need to select positions [0][0], as np.where returns a tuple, such as (array([x], dtype=int64),)
#    We want the first element, which returns an array containing the possible values.
#    Given our previous conditions, we know there should only be 1, so we select the first element
position = np.where(estimations==5)[0][0]
task_hour_data = np.array(split_array[position][:,1]).flatten()

# Plotting Norm for tasks
shapeTask, locTask, scaleTask = lognorm.fit(task_hour_data, floc=0)
fittedTask = lognorm(shapeTask, locTask, scaleTask)

print(f'P95: {fittedTask.ppf(0.05)} hours')

plot_dist(fittedTask, 0, 25);
As said previously, we use a matrix to represent a relation between story points and task completion time. In our example above, this data is storted in task_data. The matrix is then processed into a set of sub-matrices, each containing the data regarding individual story point estimations. To help visualize this approach, consider the following matrix:
np.matrix('3 5; 3 8; 4 2')
From this initial matrix, the script above generates the following sub-matrices: [3 5; 3 8] and [4 2]. In the code above, this is the result of the split_array variable.
With this approach, it is possible to retrieve all the data matching a certain story point estimation. In the example above, 5 was chosen as a story-point target. All the data related to completion time can be plotted using the plot_dist function used in the example from the previous section.
In this particular example, the data is not right-skewed, so we should be able to use a normal distribution. Plotting the data gives us the following result:
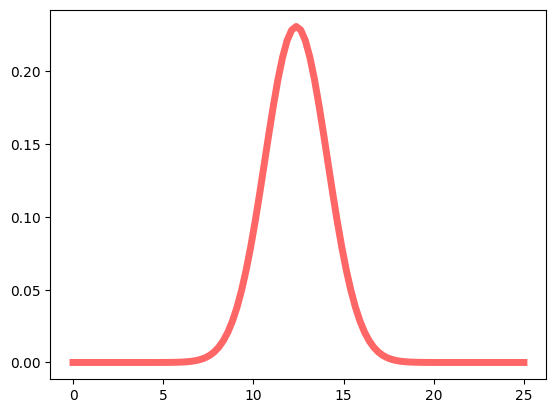
We can then calculate our P95 values, which in this case equal ≈9.53. In this case, we have 95% guarantee that a task estimated with 5 story points requires at least 9 hours to be completed.
This more granular approach should allow developers to estimate and plan sprints with a higher degree of confidence.
It is important to mention that the previous model is rather simple and could be extended with more variables to make it more accurate. For instance, if we have the knowledge about which developers will be working on which tasks a-priori, we could filter out estimations for specific developers developer. This would likely create a more accurate time estimation. Realistically, however, it is not common to pre-assign tasks to developers before the sprint starts, so this article will not explore this improvement.
Despite this approach offering a more granular overview of work progress, it still does not tell the whole picture. Tasks typically have dependencies between them, which affect how developers plan Sprints. In order to have a full overview of how many tasks we could add to a sprint, we would need to take these dependencies into account. The next section briefly discusses this topic.
A good model represents only 50% of the solution
Our model is now predicting how long tasks take based on their estimated story points. To compliment our discussion, let us assume we have been gathering story point data for some time. having this data will surely allow us to have better estimates. However, this is only half of the problem. The largest benefit would come in the form of predicting whether the tasks developers are adding to the next sprint could end up taking more time than the sprint’s total duration. To successfully calculate this, we would need to consider two factors:
- The size of the development team, and
- Task dependencies
Visualizing these dependencies could be done with a Gantt chart. This should allow developers to easily detect possible spillovers when planning a sprint. We will not provide a full implementation of this approach in this article, but we can at least visualize what it would look like using a Gantt chart. Let us consider a small team comprised of 3 developers. Sprint duration is set to 2 weeks.
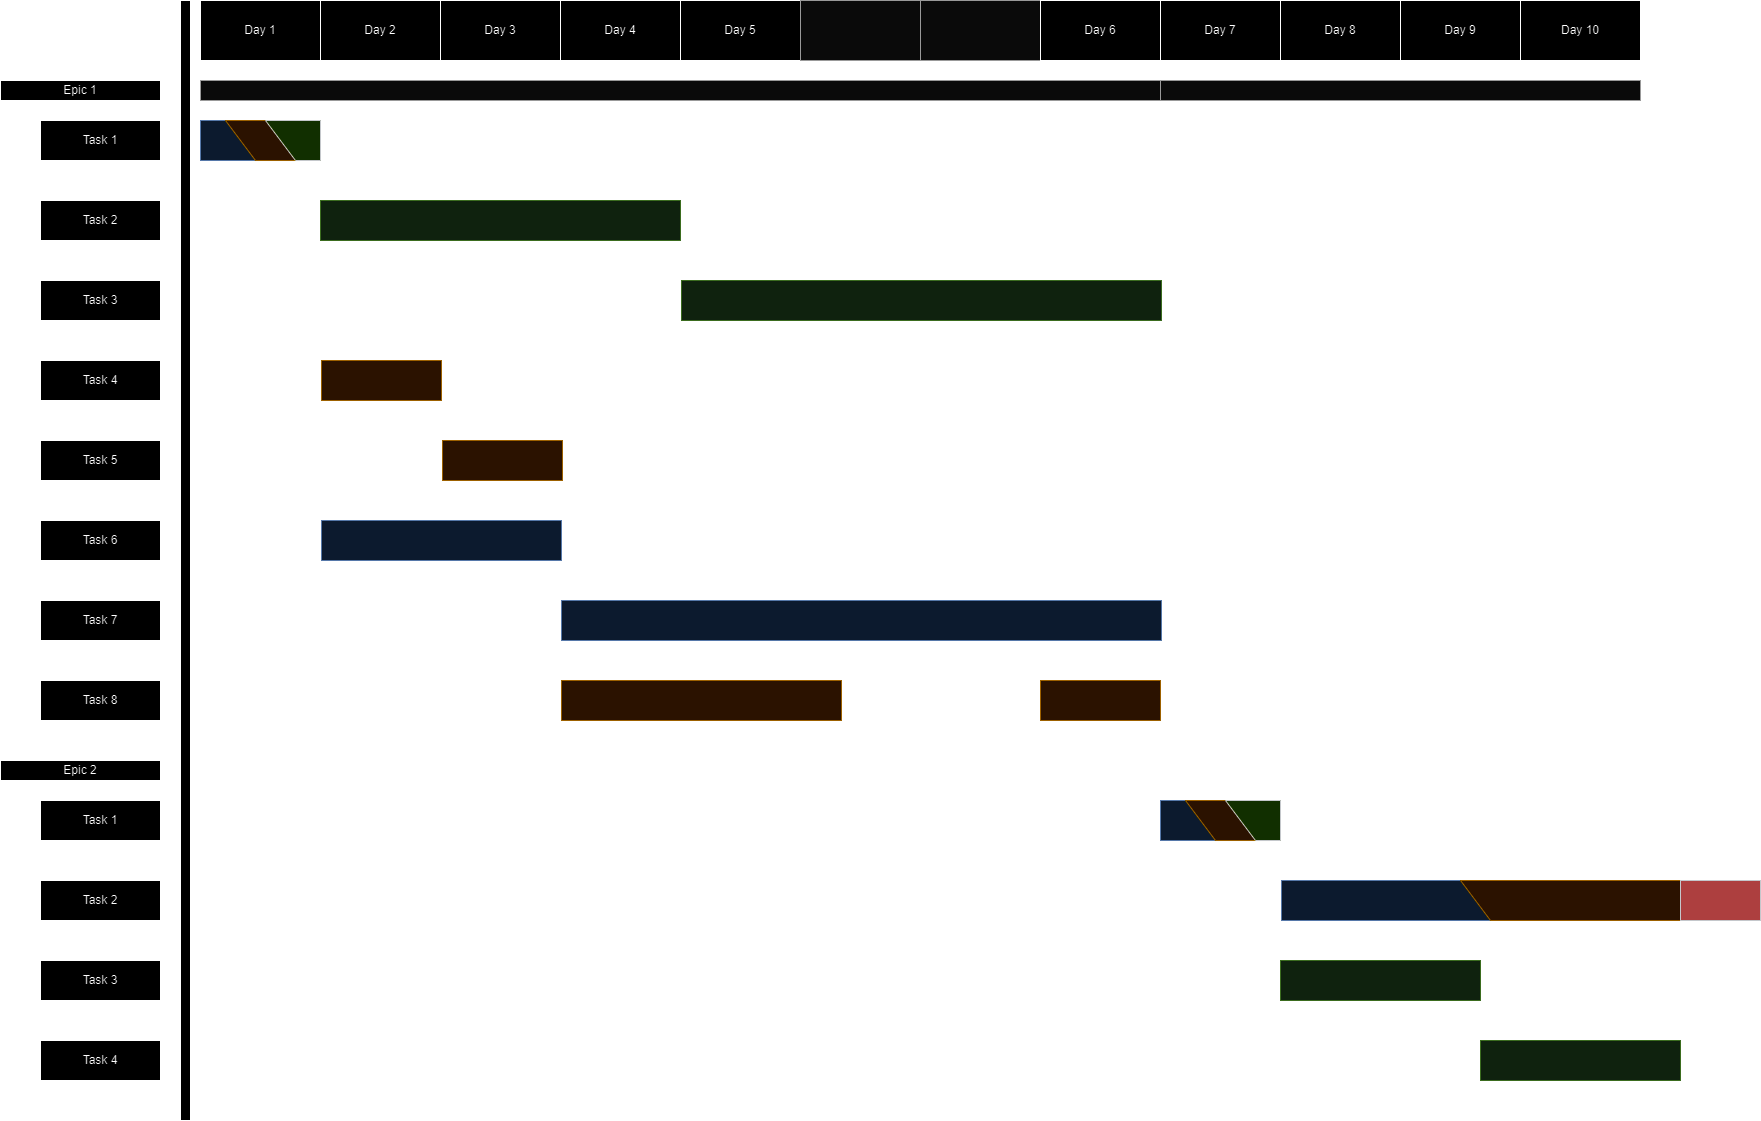
The model above illustrates a possible task assignment for a two-week sprint. Each of the three developers is assigned a unique color for easier distinction. In our example, we do not allow developers to be working on more than one task at a time. This explains why there are no overlapping colours. Tasks that have multiple colours are assigned to multiple developers, where each colour represents one developer. All tasks highlighted red exceed the time of the sprint, according to the prediction model. We can see one task wis currently exceeding the sprint’s time by 1 day. Having this information during sprint planning could enable developers to make more informed decisions in selecting tasks that align optimally with the designated sprint timeframe.
Related work
Automated task estimation is still a topic under investigation. Despite Agile development being arround for more than a decade, estimating tasks has proven to be a difficult challenge, given all the variables task estimation models have to consider.
The most common approach for estimating sprint tasks is to use regression models ([2]). These use previously gathered project data to estimate future tasks. The disadvantages to these models are similar to the ones shown in this article, which is that such models still require developers to estimate tasks. Hence they can only be reduced to facilitate sprint planning, and not fully automate it.
Other approaches define effort estimation models for Agile development ([3]). These have similarities to regression models, as they require previous project data. Therefore, they have many of the downsides of regression models.
Alternative approaches have used Bayesian networks ([4]). Such approaches present an extension to this article, as they attempt to estimate task complexity without the need for developers to provide story point estimates. Such models still require inputs from the manager, to access the dificulty of each task.
Future Work
The aim of this article was to discuss a possible approach to streamline the sprint planing process in Agile project development. In the previous sections, we discussed a potential statistical model that could help predict the running time for tasks. Nevertheless, as the goal is to develop an automated tool capable of executing unsupervised estimations, there is also a necessity to automate the retrieval of Sprint data.
Most companies these days use tools, such as Jira, to plan their sprints. A possible way to automate the previous approach, would be to systematically retrieve data from such platforms and update the statistical model. Doing so in real-time would likely have increased running cost, as we would constantly be updating the model. As a first iteration, we could do this at the end of each Sprint. This would avoid responding to events, such as task re-estimations, which could have a large impact in performance (granted, these should be very minor if the sprint was properly planned).
If this model was to be used long-term, optimizations would be required to avoid retrieving all past sprint data. Throughout this article, we have assumed that all the sprint data was available for our model. In an ideal scenario, we would just be able to update the model based on the information from new tasks.
Lastly, it would be beneficial if the model could also predict task story points without requiring estimations from developers. This topic is the subject of recent investigations ([4]), but still requires managers to input task complexity information. For more complex projects, managers will not be able to provide such information without also inquiring the development team. This makes the benefit of such approaches less appealing, as it still requires manual input from teams.
We leave these thoughts as potential future improvements for the presented approach.
Conclusion
Overall, it might be possible to estimate task running time with a certain degree of confidence. However, given that such tools might still require input from the manager and the development team, their value for industrial applications is questionable. Retrieving data from a third-party tool seems to be a feasible approach, but processing it on a large scale presents several concerns. Furthermore, we are yet to discover if we could use the information from this model to start predicting tasks without requiring inputs from developers.
Despite the drawbacks, the adoption of a statistical model has the potential to yield substantial advantages for agile development teams, providing them with a tool capable of speeding up sprint planning. Moreover, it could offer an elevated level of assurance to managers, giving them the ability to plan more accurate road maps. Investigational work is still required to determine whether this approach is feasible on a large scale, but finding a a scalable task estimation approach will likely bring huge benefits to the software industry.
Sources
- Using Statistics for Agile Estimations
- A comparison of software effort estimation techniques: Using function points with neural networks, case-based reasoning and regression models
- Estimation of the tasks complexity for large-scale high-tech projects using Agile methodologies
- Advanced Bayesian Network for Task Effort Estimation in Agile Software Development